|
 |
iOS Framework (for Xcode Swift & Objective C)
|
|
|
|
The Rustemsoft UIChart control enables to create iOS apps with simple, intuitive, and visually compelling chart for complex statistical or financial analysis in different graph types that include Pie, Bar, Line, Cylinder, Area, and other chart types. You can use the UIChart control to show graphs of a small amount of data, or you can scale it to show charts of very large sets of data.
Beginning February 1, 2020 TouchControls iOS Framework includes 64-bit support, built with the iOS 8 SDK and Xcode 6.
|
|
|
TouchControls iOS Framework library from Rustemsoft LLC is Swift | Objective C software package specifically designed for Xcode developers. The library allows you to use all strengths of the Rustemsoft UIChart control without waiving the user interface elements your customers need.
UIChart gives you the flexibility to bind to any datasource that supports a mutable array NSMutableArray object interface. And with the bunch of class properties, you can configure a chart of any complexity quickly and easily in your code.
|
|
|
|
 Chart objects can be positioned next to each other or overlap each other. This gives you the freedom to create custom charts. The plot area is found inside the chart, and is where the UIChart control plots the data series. It is also where axes, grid lines, hatch lines, gradient layouts, and chart items are drawn. Axis labels are always outside of the plot area, but most other elements are found within the plot area.
|
|
|
|
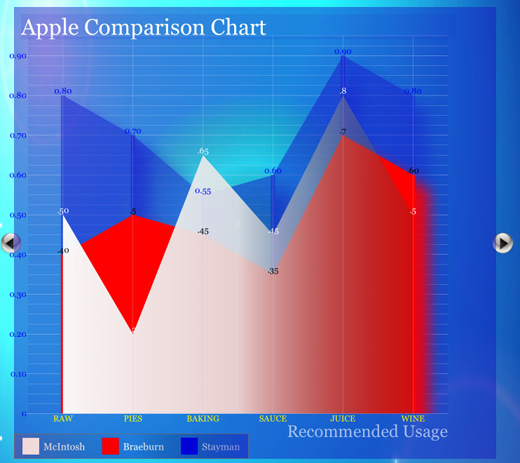
Example
The following code example creates a UIChart object as Area and adds it to the app's main view (ViewController) layout.
 OBJECTIVE-C OBJECTIVE-C
- (void)viewDidLoad
{
[super viewDidLoad];
// Create UIChart object
UIChart *chrt = [[UIChart alloc] initWithFrame:CGRectMake(10, 40, 540, 290)];
chrt.delegate = self;
// Specify chart type
chrt.chartType = area;
// Define chart's colors
chrt.backgroundColor = [UIColor colorWithRed:0.01 green:0.01 blue:0.5 alpha:0.1];
chrt.foregroundColor = [UIColor colorWithRed:0.9 green:0.9 blue:1 alpha:1];
chrt.orientation = swhOrientation.isOn ? vertical : horizontal;
// Add UIChart object into app's main view layout
[self.view addSubview:chrt];
}
 SWIFT SWIFT
override func viewDidLoad()
{
super.viewDidLoad()
// Create UIChart object
chrt = UIChart(frame: CGRect(x: 10, y: 40, width: self.view.frame.size.width - 40, height: self.view.frame.size.height - 190))
chrt.delegate = self
// Specify chart type
chrt.chartType = chartTypes.area
// Define chart's colors
chrt.backgroundColor = UIColor(red: 0.01, green:0.01, blue:0.5, alpha:0.1)
chrt.foregroundColor = UIColor(red: 0.9, green:0.9, blue:1, alpha:1)
chrt.orientation = swhOrientation.isOn ? orientations.vertical : orientations.horizontal
// Add UIChart object into app's main view layout
self.view.addSubview(chrt)
}
|
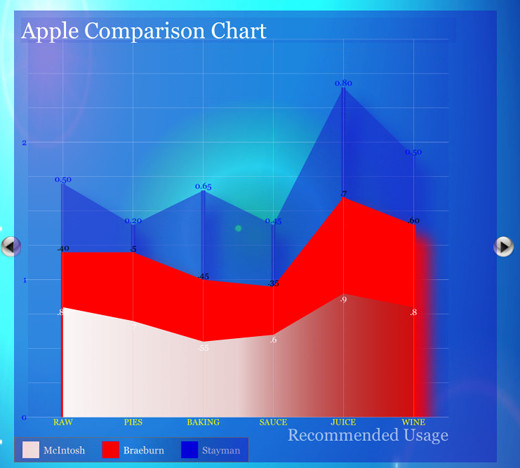
Example
The following code example creates a UIChart object as Stacked Area and adds it to the app's main view (ViewController) layout.
OBJECTIVE-C
- (void)viewDidLoad
{
[super viewDidLoad];
// Create UIChart object
UIChart *chrt = [[UIChart alloc] initWithFrame:CGRectMake(10, 40, 540, 290)];
chrt.delegate = self;
// Specify chart type
chrt.chartType = areaStacked;
// Define chart's colors
chrt.backgroundColor = [UIColor colorWithRed:0.01 green:0.01 blue:0.5 alpha:0.1];
chrt.foregroundColor = [UIColor colorWithRed:0.9 green:0.9 blue:1 alpha:1];
chrt.orientation = swhOrientation.isOn ? vertical : horizontal;
// Add UIChart object into app's main view layout
[self.view addSubview:chrt];
}
SWIFT
override func viewDidLoad()
{
super.viewDidLoad()
// Create UIChart object
chrt = UIChart(frame: CGRect(x: 10, y: 40, width: self.view.frame.size.width - 40, height: self.view.frame.size.height - 190))
chrt.delegate = self
// Specify chart type
chrt.chartType = chartTypes.areaStacked
// Define chart's colors
chrt.backgroundColor = UIColor(red: 0.01, green:0.01, blue:0.5, alpha:0.1)
chrt.foregroundColor = UIColor(red: 0.9, green:0.9, blue:1, alpha:1)
chrt.orientation = swhOrientation.isOn ? orientations.vertical : orientations.horizontal
// Add UIChart object into app's main view layout
self.view.addSubview(chrt)
}
|
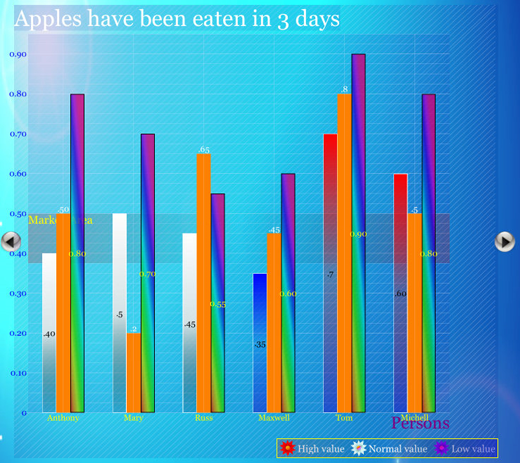
Example
The following code example creates a UIChart object as Bar and adds it to the app's main view (ViewController) layout.
OBJECTIVE-C
- (void)viewDidLoad
{
[super viewDidLoad];
// Create UIChart object
UIChart *chrt = [[UIChart alloc] initWithFrame:CGRectMake(10, 40, 540, 290)];
chrt.delegate = self;
// Specify chart type
chrt.chartType = bar;
// Define chart's colors
chrt.backgroundColor = [UIColor colorWithRed:0.01 green:0.01 blue:0.5 alpha:0.1];
chrt.foregroundColor = [UIColor colorWithRed:0.9 green:0.9 blue:1 alpha:1];
chrt.orientation = swhOrientation.isOn ? vertical : horizontal;
// Add UIChart object into app's main view layout
[self.view addSubview:chrt];
}
SWIFT
override func viewDidLoad()
{
super.viewDidLoad()
// Create UIChart object
chrt = UIChart(frame: CGRect(x: 10, y: 40, width: self.view.frame.size.width - 40, height: self.view.frame.size.height - 190))
chrt.delegate = self
// Specify chart type
chrt.chartType = chartTypes.bar
// Define chart's colors
chrt.backgroundColor = UIColor(red: 0.01, green:0.01, blue:0.5, alpha:0.1)
chrt.foregroundColor = UIColor(red: 0.9, green:0.9, blue:1, alpha:1)
chrt.orientation = swhOrientation.isOn ? orientations.vertical : orientations.horizontal
// Add UIChart object into app's main view layout
self.view.addSubview(chrt)
}
|
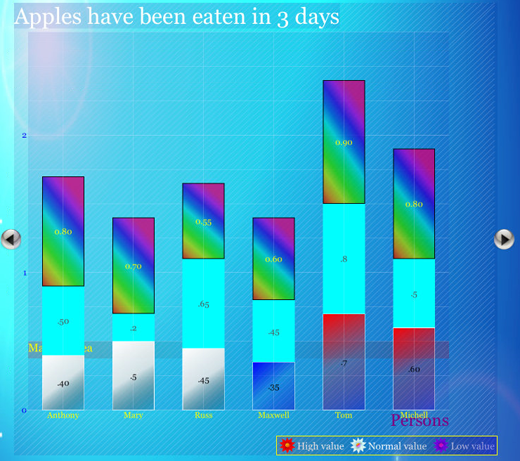
Example
The following code example creates a UIChart object as Stacked Bar and adds it to the app's main view (ViewController) layout.
OBJECTIVE-C
- (void)viewDidLoad
{
[super viewDidLoad];
// Create UIChart object
UIChart *chrt = [[UIChart alloc] initWithFrame:CGRectMake(10, 40, 540, 290)];
chrt.delegate = self;
// Specify chart type
chrt.chartType = barStacked;
// Define chart's colors
chrt.backgroundColor = [UIColor colorWithRed:0.01 green:0.01 blue:0.5 alpha:0.1];
chrt.foregroundColor = [UIColor colorWithRed:0.9 green:0.9 blue:1 alpha:1];
chrt.orientation = swhOrientation.isOn ? vertical : horizontal;
// Add UIChart object into app's main view layout
[self.view addSubview:chrt];
}
SWIFT
override func viewDidLoad()
{
super.viewDidLoad()
// Create UIChart object
chrt = UIChart(frame: CGRect(x: 10, y: 40, width: self.view.frame.size.width - 40, height: self.view.frame.size.height - 190))
chrt.delegate = self
// Specify chart type
chrt.chartType = chartTypes.barStacked
// Define chart's colors
chrt.backgroundColor = UIColor(red: 0.01, green:0.01, blue:0.5, alpha:0.1)
chrt.foregroundColor = UIColor(red: 0.9, green:0.9, blue:1, alpha:1)
chrt.orientation = swhOrientation.isOn ? orientations.vertical : orientations.horizontal
// Add UIChart object into app's main view layout
self.view.addSubview(chrt)
}
|
Example
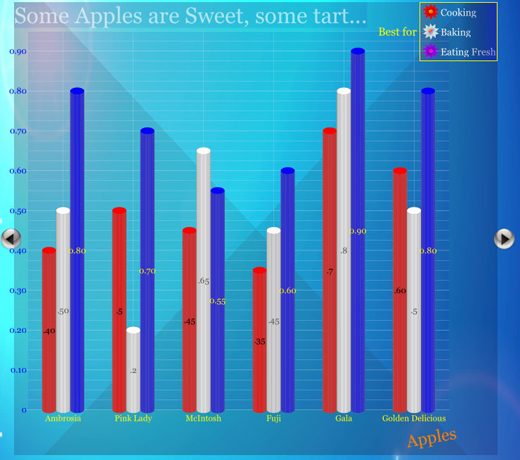
The following code example creates a UIChart object as Cylinder and adds it to the app's main view (ViewController) layout.
OBJECTIVE-C
- (void)viewDidLoad
{
[super viewDidLoad];
// Create UIChart object
UIChart *chrt = [[UIChart alloc] initWithFrame:CGRectMake(10, 40, 540, 290)];
chrt.delegate = self;
// Specify chart type
chrt.chartType = cylinder;
// Define chart's colors
chrt.backgroundColor = [UIColor colorWithRed:0.01 green:0.01 blue:0.5 alpha:0.1];
chrt.foregroundColor = [UIColor colorWithRed:0.9 green:0.9 blue:1 alpha:1];
chrt.orientation = swhOrientation.isOn ? vertical : horizontal;
// Add UIChart object into app's main view layout
[self.view addSubview:chrt];
}
SWIFT
override func viewDidLoad()
{
super.viewDidLoad()
// Create UIChart object
chrt = UIChart(frame: CGRect(x: 10, y: 40, width: self.view.frame.size.width - 40, height: self.view.frame.size.height - 190))
chrt.delegate = self
// Specify chart type
chrt.chartType = chartTypes.cylinder
// Define chart's colors
chrt.backgroundColor = UIColor(red: 0.01, green:0.01, blue:0.5, alpha:0.1)
chrt.foregroundColor = UIColor(red: 0.9, green:0.9, blue:1, alpha:1)
chrt.orientation = swhOrientation.isOn ? orientations.vertical : orientations.horizontal
// Add UIChart object into app's main view layout
self.view.addSubview(chrt)
}
|
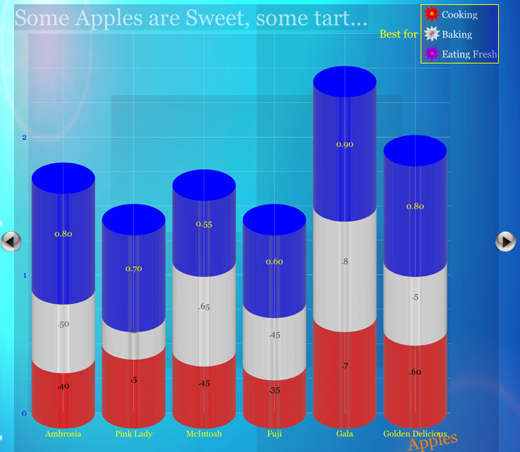
Example
The following code example creates a UIChart object as Stacked Cylinder and adds it to the app's main view (ViewController) layout.
OBJECTIVE-C
- (void)viewDidLoad
{
[super viewDidLoad];
// Create UIChart object
UIChart *chrt = [[UIChart alloc] initWithFrame:CGRectMake(10, 40, 540, 290)];
chrt.delegate = self;
// Specify chart type
chrt.chartType = cylinderStacked;
// Define chart's colors
chrt.backgroundColor = [UIColor colorWithRed:0.01 green:0.01 blue:0.5 alpha:0.1];
chrt.foregroundColor = [UIColor colorWithRed:0.9 green:0.9 blue:1 alpha:1];
chrt.orientation = swhOrientation.isOn ? vertical : horizontal;
// Add UIChart object into app's main view layout
[self.view addSubview:chrt];
}
SWIFT
override func viewDidLoad()
{
super.viewDidLoad()
// Create UIChart object
chrt = UIChart(frame: CGRect(x: 10, y: 40, width: self.view.frame.size.width - 40, height: self.view.frame.size.height - 190))
chrt.delegate = self
// Specify chart type
chrt.chartType = chartTypes.cylinderStacked
// Define chart's colors
chrt.backgroundColor = UIColor(red: 0.01, green:0.01, blue:0.5, alpha:0.1)
chrt.foregroundColor = UIColor(red: 0.9, green:0.9, blue:1, alpha:1)
chrt.orientation = swhOrientation.isOn ? orientations.vertical : orientations.horizontal
// Add UIChart object into app's main view layout
self.view.addSubview(chrt)
}
|
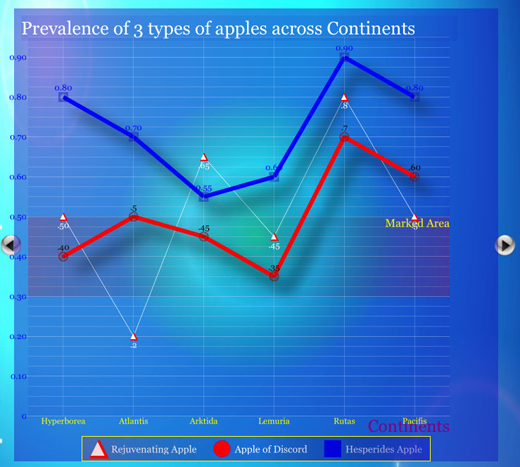
Example
The following code example creates a UIChart object as Line and adds it to the app's main view (ViewController) layout.
OBJECTIVE-C
- (void)viewDidLoad
{
[super viewDidLoad];
// Create UIChart object
UIChart *chrt = [[UIChart alloc] initWithFrame:CGRectMake(10, 40, 540, 290)];
chrt.delegate = self;
// Specify chart type
chrt.chartType = line;
// Define chart's colors
chrt.backgroundColor = [UIColor colorWithRed:0.01 green:0.01 blue:0.5 alpha:0.1];
chrt.foregroundColor = [UIColor colorWithRed:0.9 green:0.9 blue:1 alpha:1];
chrt.orientation = swhOrientation.isOn ? vertical : horizontal;
// Add UIChart object into app's main view layout
[self.view addSubview:chrt];
}
SWIFT
override func viewDidLoad()
{
super.viewDidLoad()
// Create UIChart object
chrt = UIChart(frame: CGRect(x: 10, y: 40, width: self.view.frame.size.width - 40, height: self.view.frame.size.height - 190))
chrt.delegate = self
// Specify chart type
chrt.chartType = chartTypes.line
// Define chart's colors
chrt.backgroundColor = UIColor(red: 0.01, green:0.01, blue:0.5, alpha:0.1)
chrt.foregroundColor = UIColor(red: 0.9, green:0.9, blue:1, alpha:1)
chrt.orientation = swhOrientation.isOn ? orientations.vertical : orientations.horizontal
// Add UIChart object into app's main view layout
self.view.addSubview(chrt)
}
|
Example
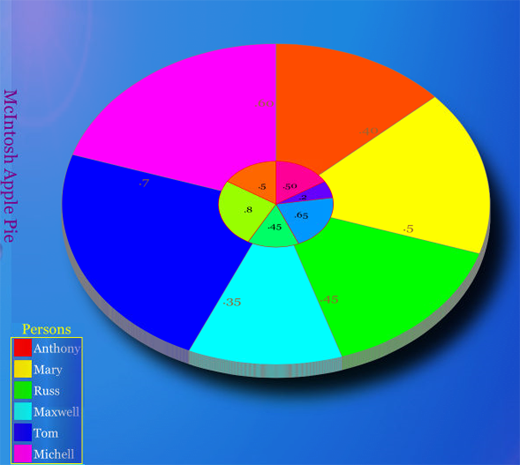
The following code example creates a UIChart object as Pie and adds it to the app's main view (ViewController) layout.
OBJECTIVE-C
- (void)viewDidLoad
{
[super viewDidLoad];
// Create UIChart object
UIChart *chrt = [[UIChart alloc] initWithFrame:CGRectMake(10, 40, 540, 290)];
chrt.delegate = self;
// Specify chart type
chrt.chartType = pie;
// Define chart's colors
chrt.backgroundColor = [UIColor colorWithRed:0.01 green:0.01 blue:0.5 alpha:0.1];
chrt.foregroundColor = [UIColor colorWithRed:0.9 green:0.9 blue:1 alpha:1];
chrt.orientation = swhOrientation.isOn ? vertical : horizontal;
// Add UIChart object into app's main view layout
[self.view addSubview:chrt];
}
SWIFT
override func viewDidLoad()
{
super.viewDidLoad()
// Create UIChart object
chrt = UIChart(frame: CGRect(x: 10, y: 40, width: self.view.frame.size.width - 40, height: self.view.frame.size.height - 190))
chrt.delegate = self
// Specify chart type
chrt.chartType = chartTypes.pie
// Define chart's colors
chrt.backgroundColor = UIColor(red: 0.01, green:0.01, blue:0.5, alpha:0.1)
chrt.foregroundColor = UIColor(red: 0.9, green:0.9, blue:1, alpha:1)
chrt.orientation = swhOrientation.isOn ? orientations.vertical : orientations.horizontal
// Add UIChart object into app's main view layout
self.view.addSubview(chrt)
}
|
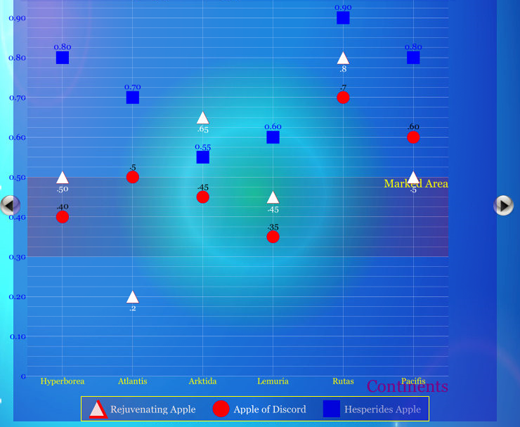
Example
The following code example creates a UIChart object as Point and adds it to the app's main view (ViewController) layout.
OBJECTIVE-C
- (void)viewDidLoad
{
[super viewDidLoad];
// Create UIChart object
UIChart *chrt = [[UIChart alloc] initWithFrame:CGRectMake(10, 40, 540, 290)];
chrt.delegate = self;
// Specify chart type
chrt.chartType = point;
// Define chart's colors
chrt.backgroundColor = [UIColor colorWithRed:0.01 green:0.01 blue:0.5 alpha:0.1];
chrt.foregroundColor = [UIColor colorWithRed:0.9 green:0.9 blue:1 alpha:1];
chrt.orientation = swhOrientation.isOn ? vertical : horizontal;
// Add UIChart object into app's main view layout
[self.view addSubview:chrt];
}
SWIFT
override func viewDidLoad()
{
super.viewDidLoad()
// Create UIChart object
chrt = UIChart(frame: CGRect(x: 10, y: 40, width: self.view.frame.size.width - 40, height: self.view.frame.size.height - 190))
chrt.delegate = self
// Specify chart type
chrt.chartType = chartTypes.point
// Define chart's colors
chrt.backgroundColor = UIColor(red: 0.01, green:0.01, blue:0.5, alpha:0.1)
chrt.foregroundColor = UIColor(red: 0.9, green:0.9, blue:1, alpha:1)
chrt.orientation = swhOrientation.isOn ? orientations.vertical : orientations.horizontal
// Add UIChart object into app's main view layout
self.view.addSubview(chrt)
}
|
|
|
|