|
|
How to use iOS Objective C Framework in Swift project?
|
|
|
Let's discuss the problem by using Rustemsoft TouchControls iOS Framework as an example. The TouchControls iOS Framework library is Swift and Objective C software package specifically designed for Xcode developers. The library allows use all strengths of the Rustemsoft UIDataGrid and UIChart controls without waiving the user interface elements your customers need.
|
|
|
To use the Rustemsoft TouchControls iOS Objective C Framework in your Swift project you have to create a Swift Bridging Header file in that project. The best way is to create the .h file Manually.
First, add a header file to your project with the name: MyProjectName-Bridging-Header.h. This will be the single header file where you import any Objective C code you need your Swift code to have access.
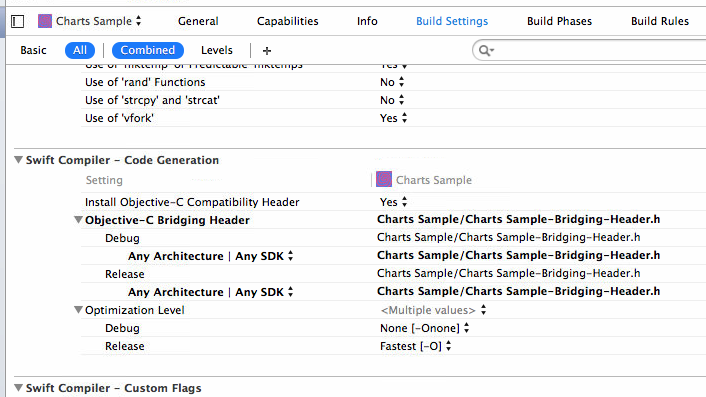
Find Swift Compiler - Code Generation section in your project build settings. Add the path to your bridging header file next to Objective C Bridging Header from the project root folder. It should be MyProject/MyProject-Bridging-Header.h
|
|
|
|
|
Do not put just MyProject-Bridging-Header.h if the file located in the project root folder. It will not work!
It just needs a single Bridging Header. Enter #import statements to this file and your classes will be available in your Swift project code without any additional #import statements.
Then make a reference to Rustemsoft TouchControls iOS Framework.
|
 What the difference between Swift and Objective C syntax?
|
|
Let's take a look of UIChart component usage. The Rustemsoft UIChart control enables to create iOS apps with simple, intuitive, and visually compelling chart for complex statistical or financial analysis in different graph types that include Pie, Bar, Line, Cylinder, Area, and other chart types.
UIChart is a control to show graphs of a small amount of data, or you can scale it to show charts of very large sets of data.
|
| · | UIChart gives you the flexibility to bind to any datasource that supports a mutable array NSMutableArray object interface. And with the bunch of class properties, you can configure a chart of any complexity quickly and easily in your code.
|
| · | Chart objects can be positioned next to each other or overlap each other. This gives you the freedom to create custom charts.
|
| · | Each chart contains a plot area, where the Chart control plots the data series. When you change the appearance properties of the chart, it changes the appearance of the plot area.
|
| · | The plot area is found inside the chart, and is where the UIChart control plots the data series. It is also where axes, grid lines, hatch lines, gradient layouts, and chart items are drawn. Axis labels are always outside of the plot area, but most other elements are found within the plot area.
|
|
| Also we have built Xcode sample projects that describe the concepts and techniques that you can use to build UIChart features into your apps.
|
|  OBJECTIVE-C OBJECTIVE-C
|
| UIChart *chart = [[UIChart alloc] init];
|
|  SWIFT SWIFT
|
var chart = UIChart()
| The following example creates a UIChart object as Pie and adds it to the app's main view (ViewController) layout.
|
| OBJECTIVE-C
|
| UIChart *chrt = [[UIChart alloc] initWithFrame:CGRectMake(10, 40, self.view.frame.size.width - 40, self.view.frame.size.height - 190)];
|
| // set UIChart's delegate to self (otherwise events will not work)
|
| // Add UIChart object into app's main view layout
|
| [self.view addSubview:chrt];
|
| chrt.backgroundColor = [UIColor colorWithRed:0.01 green:0.01 blue:0.5 alpha:0.1];
|
| chrt.foregroundColor = [UIColor colorWithRed:0.9 green:0.9 blue:1 alpha:1];
|
| chrt.orientation = swhOrientation.isOn ? vertical : horizontal;
|
| // Define chart plot area
|
| chrt.plotArea.backgroundColor = [UIColor colorWithRed:0.1 green:0.1 blue:0.8 alpha:0.1];
|
| // Define data sources for chart items
|
| lblSampleTitle.text = @"Pie Chart";
|
| // Define chart's Layout style
|
| chrt.layoutStyle = layoutStyleGradient;
|
| // Define chart's gradient
|
| chrt.gradientStyle = gradientStyleRadial;
|
| chrt.gradientRadius = 200;
|
| chrt.gradientColorTop = [UIColor colorWithRed:0.1 green:0.8 blue:0.1 alpha:0.4];
|
| chrt.gradientColorTopExtra = [UIColor clearColor];
|
| chrt.gradientColorBottom = [UIColor clearColor];
|
| chrt.gradientColorBottomExtra = [UIColor colorWithRed:0.1 green:0.1 blue:0.8 alpha:0.4];
|
| chrt.gradientDirection = gradientDirectionHorizontal;
|
| chrt.chartTitle.text = @"Who did eat more apples?";
|
| [chrt.chartTitle setFont:[UIFont fontWithName:@"Georgia" size:16]];
|
| [chrt.chartTitle setBackgroundColor:[UIColor colorWithRed:0.1 green:0.1 blue:0.8 alpha:0.1]];
|
| [chrt.chartTitle setTextColor:[UIColor whiteColor]];
|
| chrt.chartTitle.frame = CGRectMake(5, 5, 185, 18);
|
| chrt.xAxisTitleLabel.text = @"Jonathan Apple Sauce";
|
| chrt.xAxisTitleLabel.textColor = [UIColor purpleColor];
|
| chrt.xAxisTitleLabel.font = [UIFont fontWithName:@"Georgia" size:10];
|
| chrt.xAxisTitleHorizontalLocation = horizontalLocationMid;
|
| chrt.yAxisTitleLabel.text = @"McIntosh Apple Pie";
|
| chrt.yAxisTitleLabel.textColor = [UIColor purpleColor];
|
| chrt.yAxisTitleLabel.font = [UIFont fontWithName:@"Georgia" size:10];
|
| chrt.yAxisTitleLabel.frame = CGRectMake(-83, 160, 185, 18);
|
| chrt.yAxisTitleVerticalLocation = verticalLocationMid;
|
| chrt.legendZone.layer.borderColor = [UIColor yellowColor].CGColor;
|
| chrt.legendZone.layer.borderWidth = 0.5;
|
| chrt.legendZone.Title.font = [UIFont fontWithName:@"Georgia" size:8];
|
| chrt.legendZone.Title.text = @"Persons";
|
| chrt.legendZone.Title.textColor = [UIColor yellowColor];
|
| chrt.legendZone.titleVerticalLocation = verticalLocationTop;
|
| chrt.legendZone.titleHorizontalLocation = horizontalLocationMid;
|
| chrt.legendZoneHorizontalLocation = horizontalLocationLeft;
|
| chrt.legendZoneVerticalLocation = verticalLocationBottom;
|
| chrt.legendsInterpositions = vertical;
|
| ChartSeries *series0 = [[ChartSeries alloc] init];
|
| ChartSeries *series1 = [[ChartSeries alloc] init];
|
| series0.pie3D = !swhNegativeSeries.on;
|
| series0.shape.shadowColor = [UIColor blackColor].CGColor;
|
| series0.shape.shadowOpacity = .9;
|
| series0.shape.shadowOffset = CGSizeMake(10, 10);
|
| series0.shape.shadowRadius = 10;
|
| series0.shape.shadowPath = series0.shape.path;
|
| series0.shape.lineWidth = .3;
|
| // Fill out chart items collection
|
| for (NSMutableArray *itm in dataItmsSeries0) {
|
| ChartItem *chartItem = [[ChartItem alloc] init];
|
| chartItem.value = [[itm objectAtIndex:1] floatValue];
|
| chartItem.Title.text = [itm objectAtIndex:1];
|
| chartItem.Title.textColor = [UIColor brownColor];
|
| chartItem.Title.font = [UIFont fontWithName:@"Georgia" size:8];
|
| chartItem.layer.borderColor = [UIColor whiteColor].CGColor;
|
| chartItem.layer.borderWidth = 0.3;
|
| chartItem.layoutStyle = layoutStyleFlat;
|
| chartItem.titleVerticalLocation = verticalLocationBottom;
|
| chartItem.titleHorizontalLocation = horizontalLocationMid;
|
| // Create legend bullet to add into the legend zone
|
| legend *lgd = [[legend alloc] init];
|
| lgd.legendLabel.text = [itm objectAtIndex:0];
|
| lgd.legendLabel.font = [UIFont fontWithName:@"Georgia" size:7];
|
| lgd.legendBulletType = legendBulletTypeRect;
|
| // Specify legend bullet's color
|
| CGFloat colorHue = i / (CGFloat)(dataItmsSeries0.count);
|
| lgd.legendBulletFillColor = [UIColor colorWithHue:colorHue saturation:1 brightness:1 alpha:1];
|
| lgd.legendBulletWidth = 10;
|
| // Add legend bullet into legend zone
|
| [chrt.legends addObject:lgd];
|
| // Add chart item into series
|
| [series0.Items addObject:chartItem];
|
| series1.pie3D = !swhNegativeSeries.on;
|
| series1.shape.lineWidth = .3;
|
| series1.shape.strokeColor = [UIColor redColor].CGColor;
|
| for (NSMutableArray *itm in dataItmsSeries1) {
|
| ChartItem *chartItem = [[ChartItem alloc] init];
|
| chartItem.value = [[itm objectAtIndex:1] floatValue];
|
| chartItem.Title.text = [itm objectAtIndex:1];
|
| chartItem.Title.textColor = [UIColor blackColor];
|
| chartItem.Title.font = [UIFont fontWithName:@"Georgia" size:6];
|
| chartItem.titleHorizontalLocation = horizontalLocationMid;
|
| chartItem.titleVerticalLocation = verticalLocationMid;
|
| chartItem.pointWidth = 0;
|
| chartItem.layoutStyle = layoutStyleFlat;
|
| // Add chart item into series
|
| [series1.Items addObject:chartItem];
|
| [chrt.series addObject:series0];
|
| [chrt.series addObject:series1];
|
| SWIFT
|
| override func viewDidLoad()
|
| chrt = UIChart(frame: CGRect(x: 10, y: 40, width: self.view.frame.size.width - 40, height: self.view.frame.size.height - 190))
|
| // Add UIChart object into app's main view layout
|
| self.view.addSubview(chrt)
|
| chrt.chartType = chartTypes.pie
|
| lblSampleTitle.text = "Pie Chart"
|
| // Define chart's Layout style
|
| chrt.layoutStyle = layoutStyles.Gradient
|
| // Define chart's gradient
|
| chrt.gradientStyle = gradientStyles.Radial
|
| chrt.gradientRadius = 200
|
| chrt.gradientColorTop = UIColor(red: 0.1, green:0.8, blue:0.1, alpha:0.4)
|
| chrt.gradientColorTopExtra = UIColor.clearColor()
|
| chrt.gradientColorBottom = UIColor.clearColor()
|
| chrt.gradientColorBottomExtra = UIColor(red: 0.1, green:0.1, blue:0.8, alpha:0.4)
|
| chrt.gradientDirection = gradientDirections.Horizontal
|
| chrt.chartTitle.text = "Who did eat more apples?"
|
| chrt.chartTitle.font = UIFont(name: "Georgia", size: COEFF_PAD * 16)
|
| chrt.chartTitle.backgroundColor = UIColor(red: 0.1, green:0.1, blue:0.8, alpha:0.1)
|
| chrt.chartTitle.textColor = UIColor.whiteColor()
|
| chrt.chartTitle.frame = CGRectMake(COEFF_PAD * 5, COEFF_PAD * 5, COEFF_PAD * 185, COEFF_PAD * 18)
|
| chrt.xAxisTitleLabel.text = "Jonathan Apple Sauce"
|
| chrt.xAxisTitleLabel.textColor = UIColor.purpleColor()
|
| chrt.xAxisTitleLabel.font = UIFont(name:"Georgia", size:COEFF_PAD * 10)
|
| chrt.xAxisTitleHorizontalLocation = horizontalLocations.Mid
|
| chrt.yAxisTitleLabel.text = "McIntosh Apple Pie"
|
| chrt.yAxisTitleLabel.textColor = UIColor.purpleColor()
|
| chrt.yAxisTitleLabel.font = UIFont(name:"Georgia", size:COEFF_PAD * 10)
|
| chrt.yAxisTitleLabel.frame = CGRectMake(COEFF_PAD * -83, COEFF_PAD * 160, COEFF_PAD * 185, COEFF_PAD * 18)
|
| chrt.yAxisTitleVerticalLocation = verticalLocations.Mid
|
| chrt.legendZone.layer.borderColor = UIColor.yellowColor().CGColor
|
| chrt.legendZone.layer.borderWidth = COEFF_PAD * 0.5
|
| chrt.legendZone.Title.font = UIFont(name:"Georgia", size:COEFF_PAD * 8)
|
| chrt.legendZone.Title.text = "Persons"
|
| chrt.legendZone.Title.textColor = UIColor.yellowColor()
|
| chrt.legendZone.titleVerticalLocation = verticalLocations.Top
|
| chrt.legendZone.titleHorizontalLocation = horizontalLocations.Mid
|
| chrt.legendZoneHorizontalLocation = horizontalLocations.Left
|
| chrt.legendZoneVerticalLocation = verticalLocations.Bottom
|
| chrt.legendsInterpositions = orientations.vertical
|
| srs0.pie3D = !swhNegativeSeries.on
|
| srs0.shape.shadowColor = UIColor.blackColor().CGColor
|
| srs0.shape.shadowOpacity = 0.9
|
| srs0.shape.shadowOffset = CGSizeMake(COEFF_PAD * 10, COEFF_PAD * 10)
|
| srs0.shape.shadowRadius = 10
|
| srs0.shape.shadowPath = srs0.shape.path
|
| srs0.shape.lineWidth = COEFF_PAD * 0.3
|
| // Fill out chart items collection
|
| for var i = 0; i < dataItmsSeries0.count; i++ {
|
| var itm = dataItmsSeries0.objectAtIndex(i) as NSMutableArray
|
| chIt.value = CGFloat((itm.objectAtIndex(1) as NSString).doubleValue)
|
| chIt.Title.text = itm.objectAtIndex(1) as NSString
|
| chIt.Title.textColor = UIColor.brownColor()
|
| chIt.Title.font = UIFont(name:"Georgia", size:COEFF_PAD * 8)
|
| chIt.layer.borderColor = UIColor.whiteColor().CGColor
|
| chIt.layer.borderWidth = COEFF_PAD * 0.3
|
| chIt.layoutStyle = layoutStyles.Flat
|
| chIt.titleVerticalLocation = verticalLocations.Bottom
|
| chIt.titleHorizontalLocation = horizontalLocations.Mid
|
| // Create legend bullet to add into the legend zone
|
| lgd.legendLabel.text = itm.objectAtIndex(0) as NSString
|
| lgd.legendLabel.font = UIFont(name:"Georgia", size:COEFF_PAD * 7)
|
| lgd.legendBulletType = legendBulletTypes.Rect
|
| // Specify legend bullet's color
|
| var colorHue: CGFloat = CGFloat(Double(i) / Double(dataItmsSeries0.count))
|
| lgd.legendBulletFillColor = UIColor(hue: colorHue, saturation:1, brightness:1, alpha:1)
|
| lgd.legendBulletWidth = COEFF_PAD * 10
|
| // Add legend bullet into legend zone
|
| chrt.legends.addObject(lgd)
|
| // Add chart item into series
|
| srs0.Items.addObject(chIt)
|
| srs1.pie3D = !swhNegativeSeries.on
|
| srs1.shape.lineWidth = COEFF_PAD * 0.3
|
| srs1.shape.strokeColor = UIColor.redColor().CGColor
|
| for var i = 0; i < dataItmsSeries1.count; i++ {
|
| var itm = dataItmsSeries1.objectAtIndex(i) as NSMutableArray
|
| chIt.value = CGFloat((itm.objectAtIndex(1) as NSString).doubleValue)
|
| chIt.Title.text = itm.objectAtIndex(1) as NSString
|
| chIt.Title.textColor = UIColor.blackColor()
|
| chIt.Title.font = UIFont(name:"Georgia", size:COEFF_PAD * 6)
|
| chIt.titleHorizontalLocation = horizontalLocations.Mid
|
| chIt.titleVerticalLocation = verticalLocations.Mid
|
| chIt.layoutStyle = layoutStyles.Flat
|
| // Add chart item into series
|
| srs1.Items.addObject(chIt)
|
| chrt.series.addObject(srs0)
|
| chrt.series.addObject(srs1)
|
|
|
|
| |